Bellwether
702 rolling origins · 3 markets · 2 years of EIA hourly demand
What it does
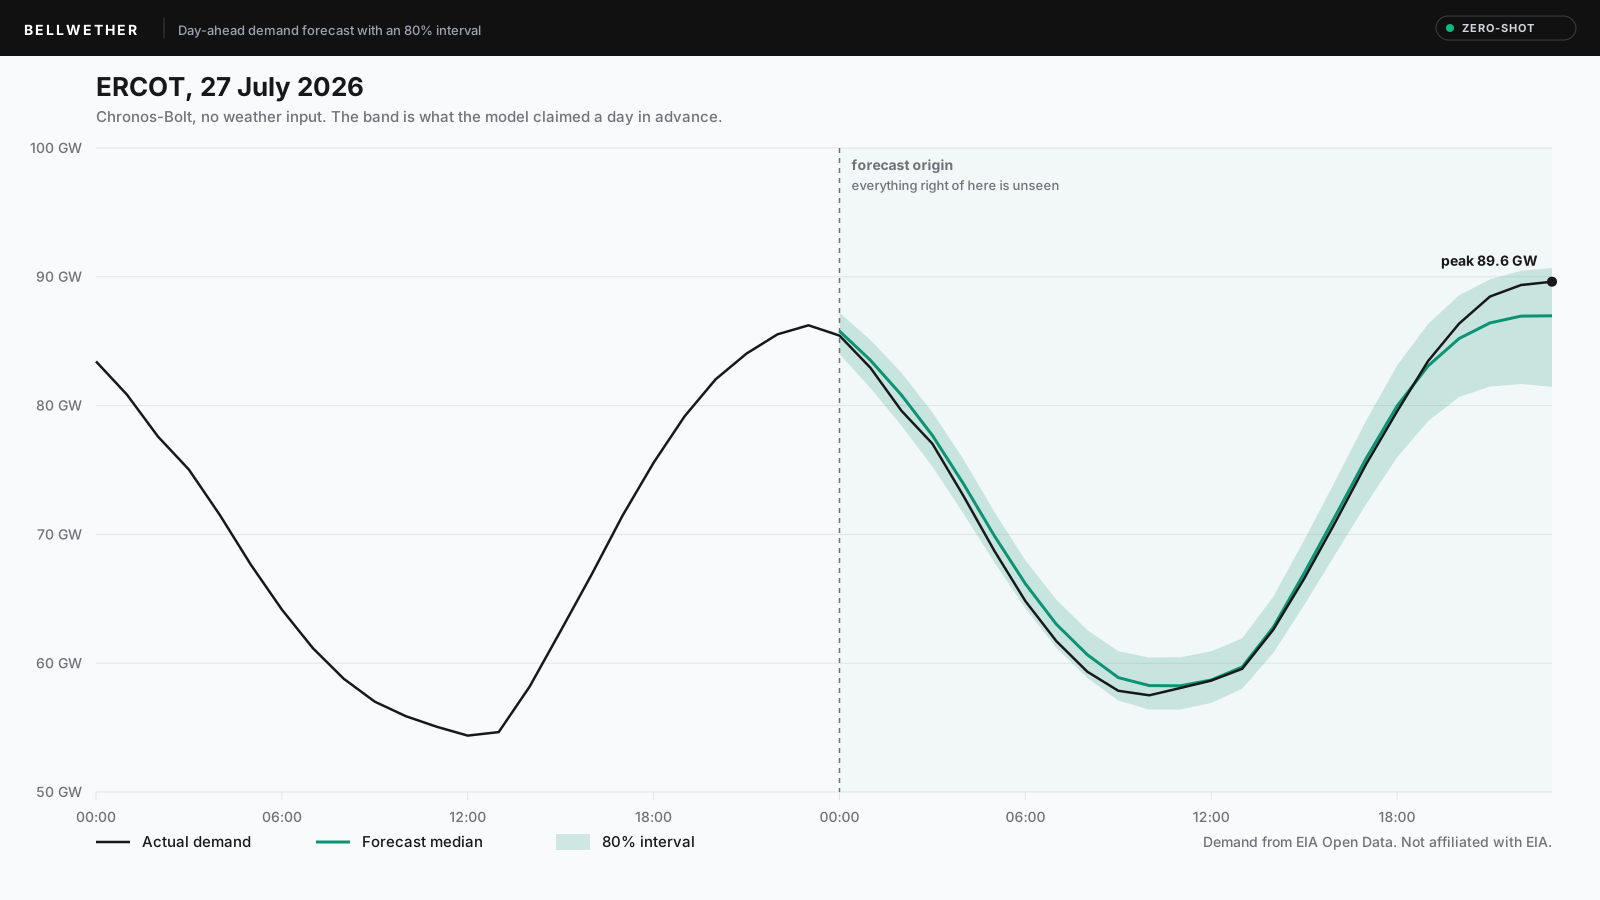
Bellwether reads two years of hourly electricity demand for three US markets, forecasts the next 24 hours, publishes an 80 percent interval around every forecast, and then reports how often the demand that actually arrived landed inside that interval. The three markets are ERCOT in Texas, CAISO in California, and PacifiCorp East in the Mountain West. All of it runs on public data from EIA Open Data, which also publishes each balancing authority's own day-ahead forecast as a series alongside actual demand. That second series is what makes the project worth building, because it means every forecast can be scored against the people who actually run the grid instead of against a benchmark of my own choosing.
Data and the evaluation harness
The demand and operator forecast series come from the EIA v2 API. Temperature comes from NOAA's Integrated Surface Database, with 14 airport stations mapped to the three markets and combined by population weight into one temperature series per market, and forecast temperature comes from the NOAA NDFD archive. Forecasting is done by two pretrained models used zero-shot, Amazon's Chronos-Bolt and Google's TimesFM 2.5, alongside daily and weekly seasonal-naive baselines and the operator's own published numbers. Evaluation is rolling-origin: the forecast origin advances by 24 hours through the full history, each model sees only the data available before that moment, and every market produces 702 scored windows. Every model sits behind one interface and returns nine quantiles, so no model gets an easier path through the harness than any other.
What the comparison found
The most useful thing in the data is that the incumbent comparison splits by market. ERCOT's own day-ahead forecast is 31.1 percent better on sMAPE than the best model I ran against it. PacifiCorp East's is 53.4 percent worse than the same zero-shot model, and worse than a daily seasonal naive as well. Two operators reporting into the same EIA series are that far apart in accuracy, which says more about forecasting investment than about any modelling technique. The zero-shot gains against the statistical baselines follow the same shape, with sMAPE cut 43.4 percent on CAISO, 29.2 percent on PacifiCorp East, and 25.5 percent on ERCOT, without a single weather input. Holiday behaviour splits the same way. On ERCOT the effect is large and specific, with demand running 2,315 MW below normal at 8am on the six holidays private employers close for, and in the other two markets there is no holiday effect worth correcting at all.
Why coverage is always printed next to width
Intervals are where the dashboard takes a position. Coverage is usually published on its own, and on its own it cannot be read, because a model can widen its interval until coverage looks excellent and no reader of a coverage column would ever know. Bellwether prints coverage and width together everywhere they appear. The nominal 80 percent band covers 77.4 percent of hours on ERCOT, 79.1 on PacifiCorp East, and 79.6 on CAISO, and that same market ordering reproduces on TimesFM and on a smaller Chronos checkpoint, which places the miscalibration in the demand series themselves and not in any one model. The clearest example of why width belongs in the table is CAISO, where the smaller 48M parameter checkpoint posts the highest coverage figure in the whole project at 81.4 percent, and did it by drawing a band 10.1 percent wider.
How the dashboard is served
Nothing computes when the page loads. The published dashboard reads committed Parquet and JSON, with no database, no API call, and no model anywhere on the serving path, and it ships as static HTML with the charts compiled to Vega-Lite. The cost of that is freshness, since the page can only show what was last exported, and refreshing it means running the harness again. What it buys is a page that cannot break in public because a data source rate-limited it.
Limits worth stating
Two limits are worth stating plainly. The temperature results are a ceiling, since the corrector reads temperature at the hour being forecast, which no operational system would have. A second arm restricted to NDFD runs published before each forecast window opened exists to measure how much of that ceiling survives, and about four fifths of it does. The weather archive also ends before the demand data does, so every temperature experiment covers a little over half the available history. CAISO is excluded from the operator comparison because its midday published forecast disagrees with its own demand series in a way I have not been able to explain, which is a data quality finding I would rather report than quietly work around.
Who it is useful for
What the project is good for is deciding whether a pretrained model is worth using on a series someone already forecasts. A benchmark aggregate cannot settle that question for any particular series, and this is a worked example of settling it on public data with the incumbent included in the comparison. Three pieces of it travel beyond electricity. The harness scores any series that has a competing published forecast, since every model sits behind the same interface and is judged on the same windows. The habit of publishing width alongside coverage applies to any interval anyone reports. And for PacifiCorp East the finding is directly usable, because a published day-ahead forecast that loses to a daily seasonal naive is a measured accuracy gap on a series that market already produces every day.
Sources and attribution
Demand and operator forecasts come from EIA Open Data, and temperature from NOAA's Integrated Surface Database and NDFD archive. This project is not affiliated with or endorsed by either agency, and its forecasts are not authoritative.
Key results
- sMAPE cut 25.5% to 43.4% below a seasonal-naive baseline, zero-shot with no weather input
- Beats PacifiCorp East's published day-ahead forecast by 53.4%; ERCOT's beats it by 31.1%
- 80% intervals cover 77.4% to 79.6% of hours, always published next to their width
Stack