What I've Built
11 projects shown
Bellwether
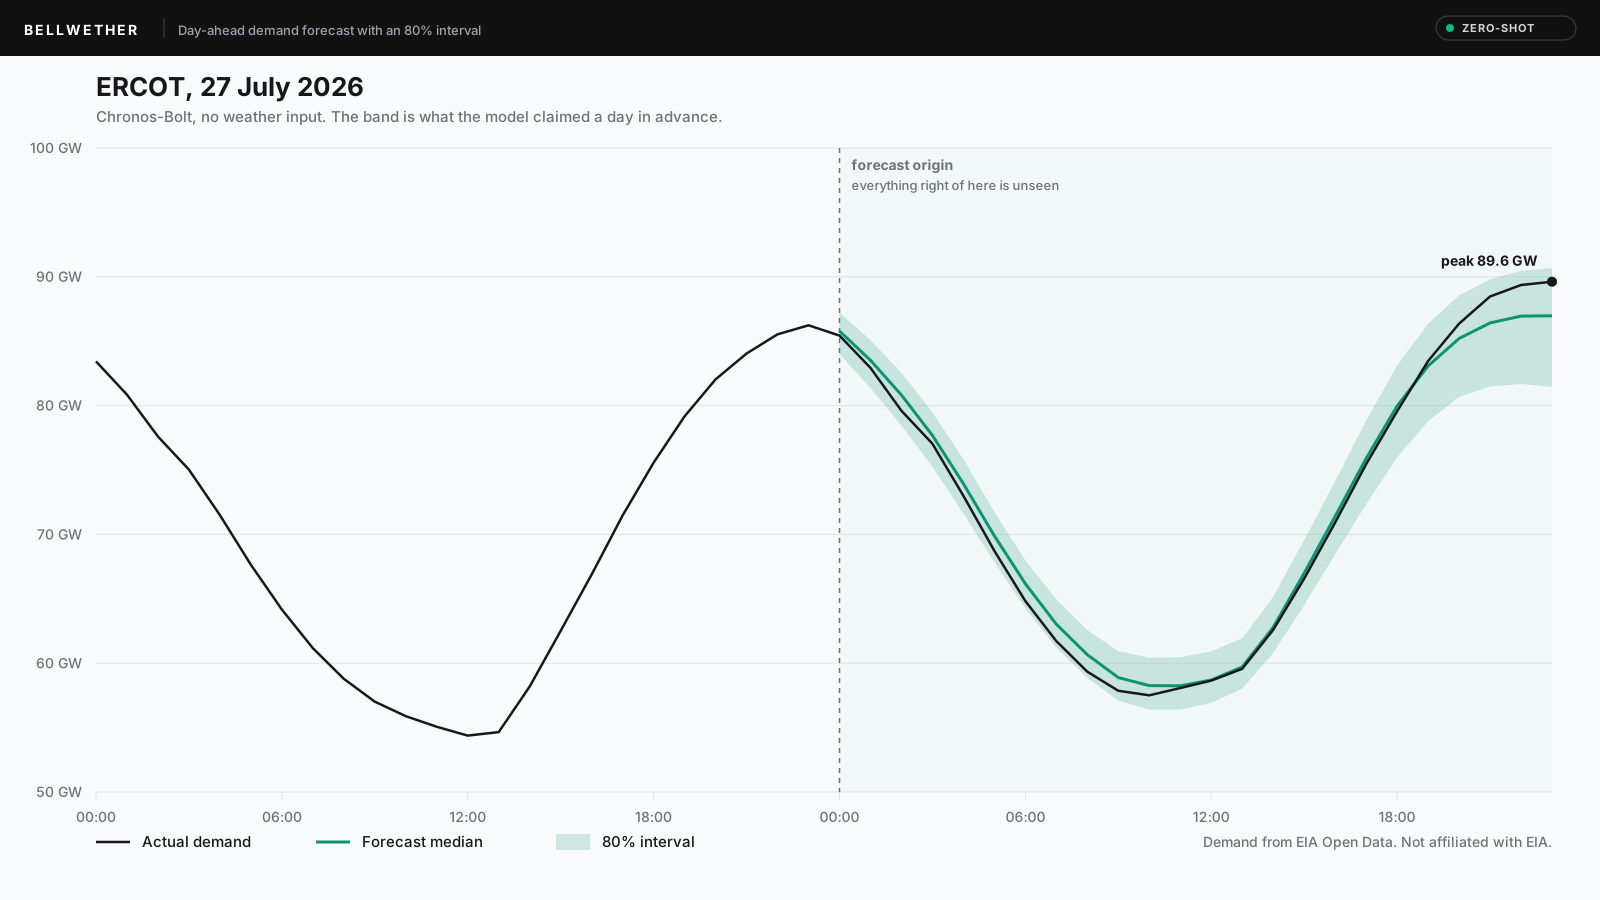
A dashboard over two years of hourly US electricity demand from EIA Open Data, forecasting the next 24 hours for ERCOT, CAISO, and PacifiCorp East and scoring every interval against what actually happened.
RHC Causal Inference
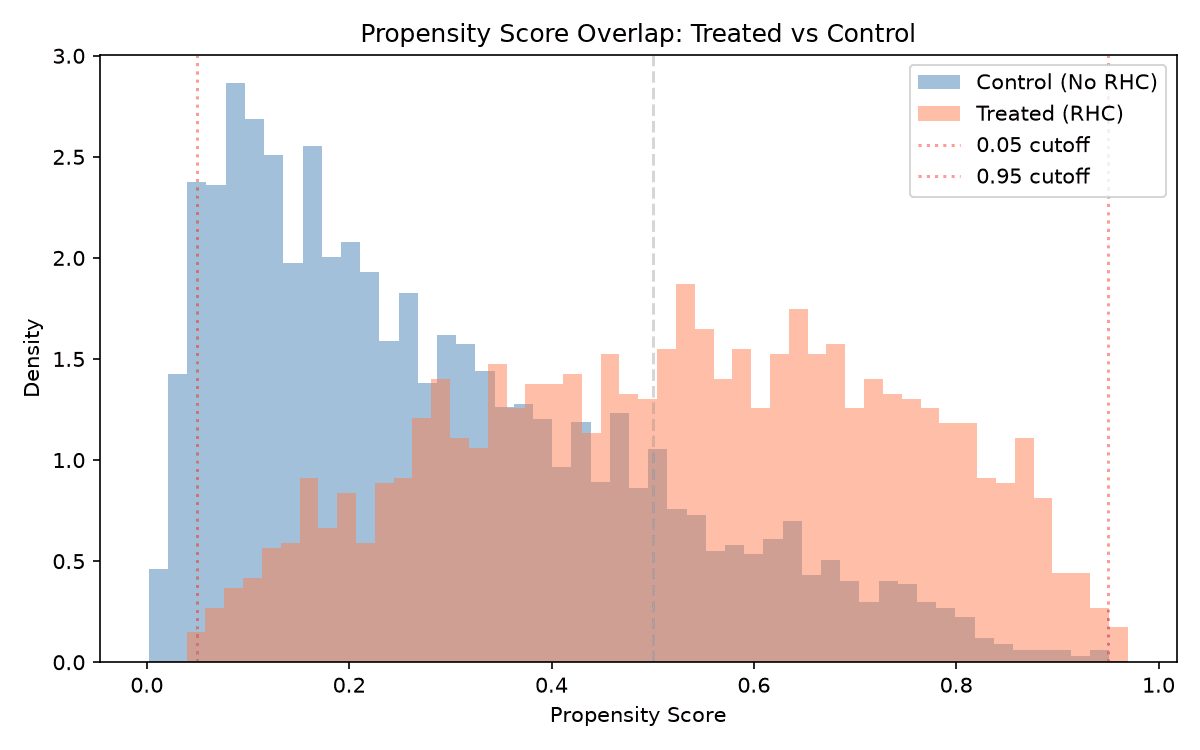
Estimates the causal effect of right heart catheterization on ICU mortality using propensity score weighting, doubly robust estimation, and E-value analysis.
CMS Readmission Predictor
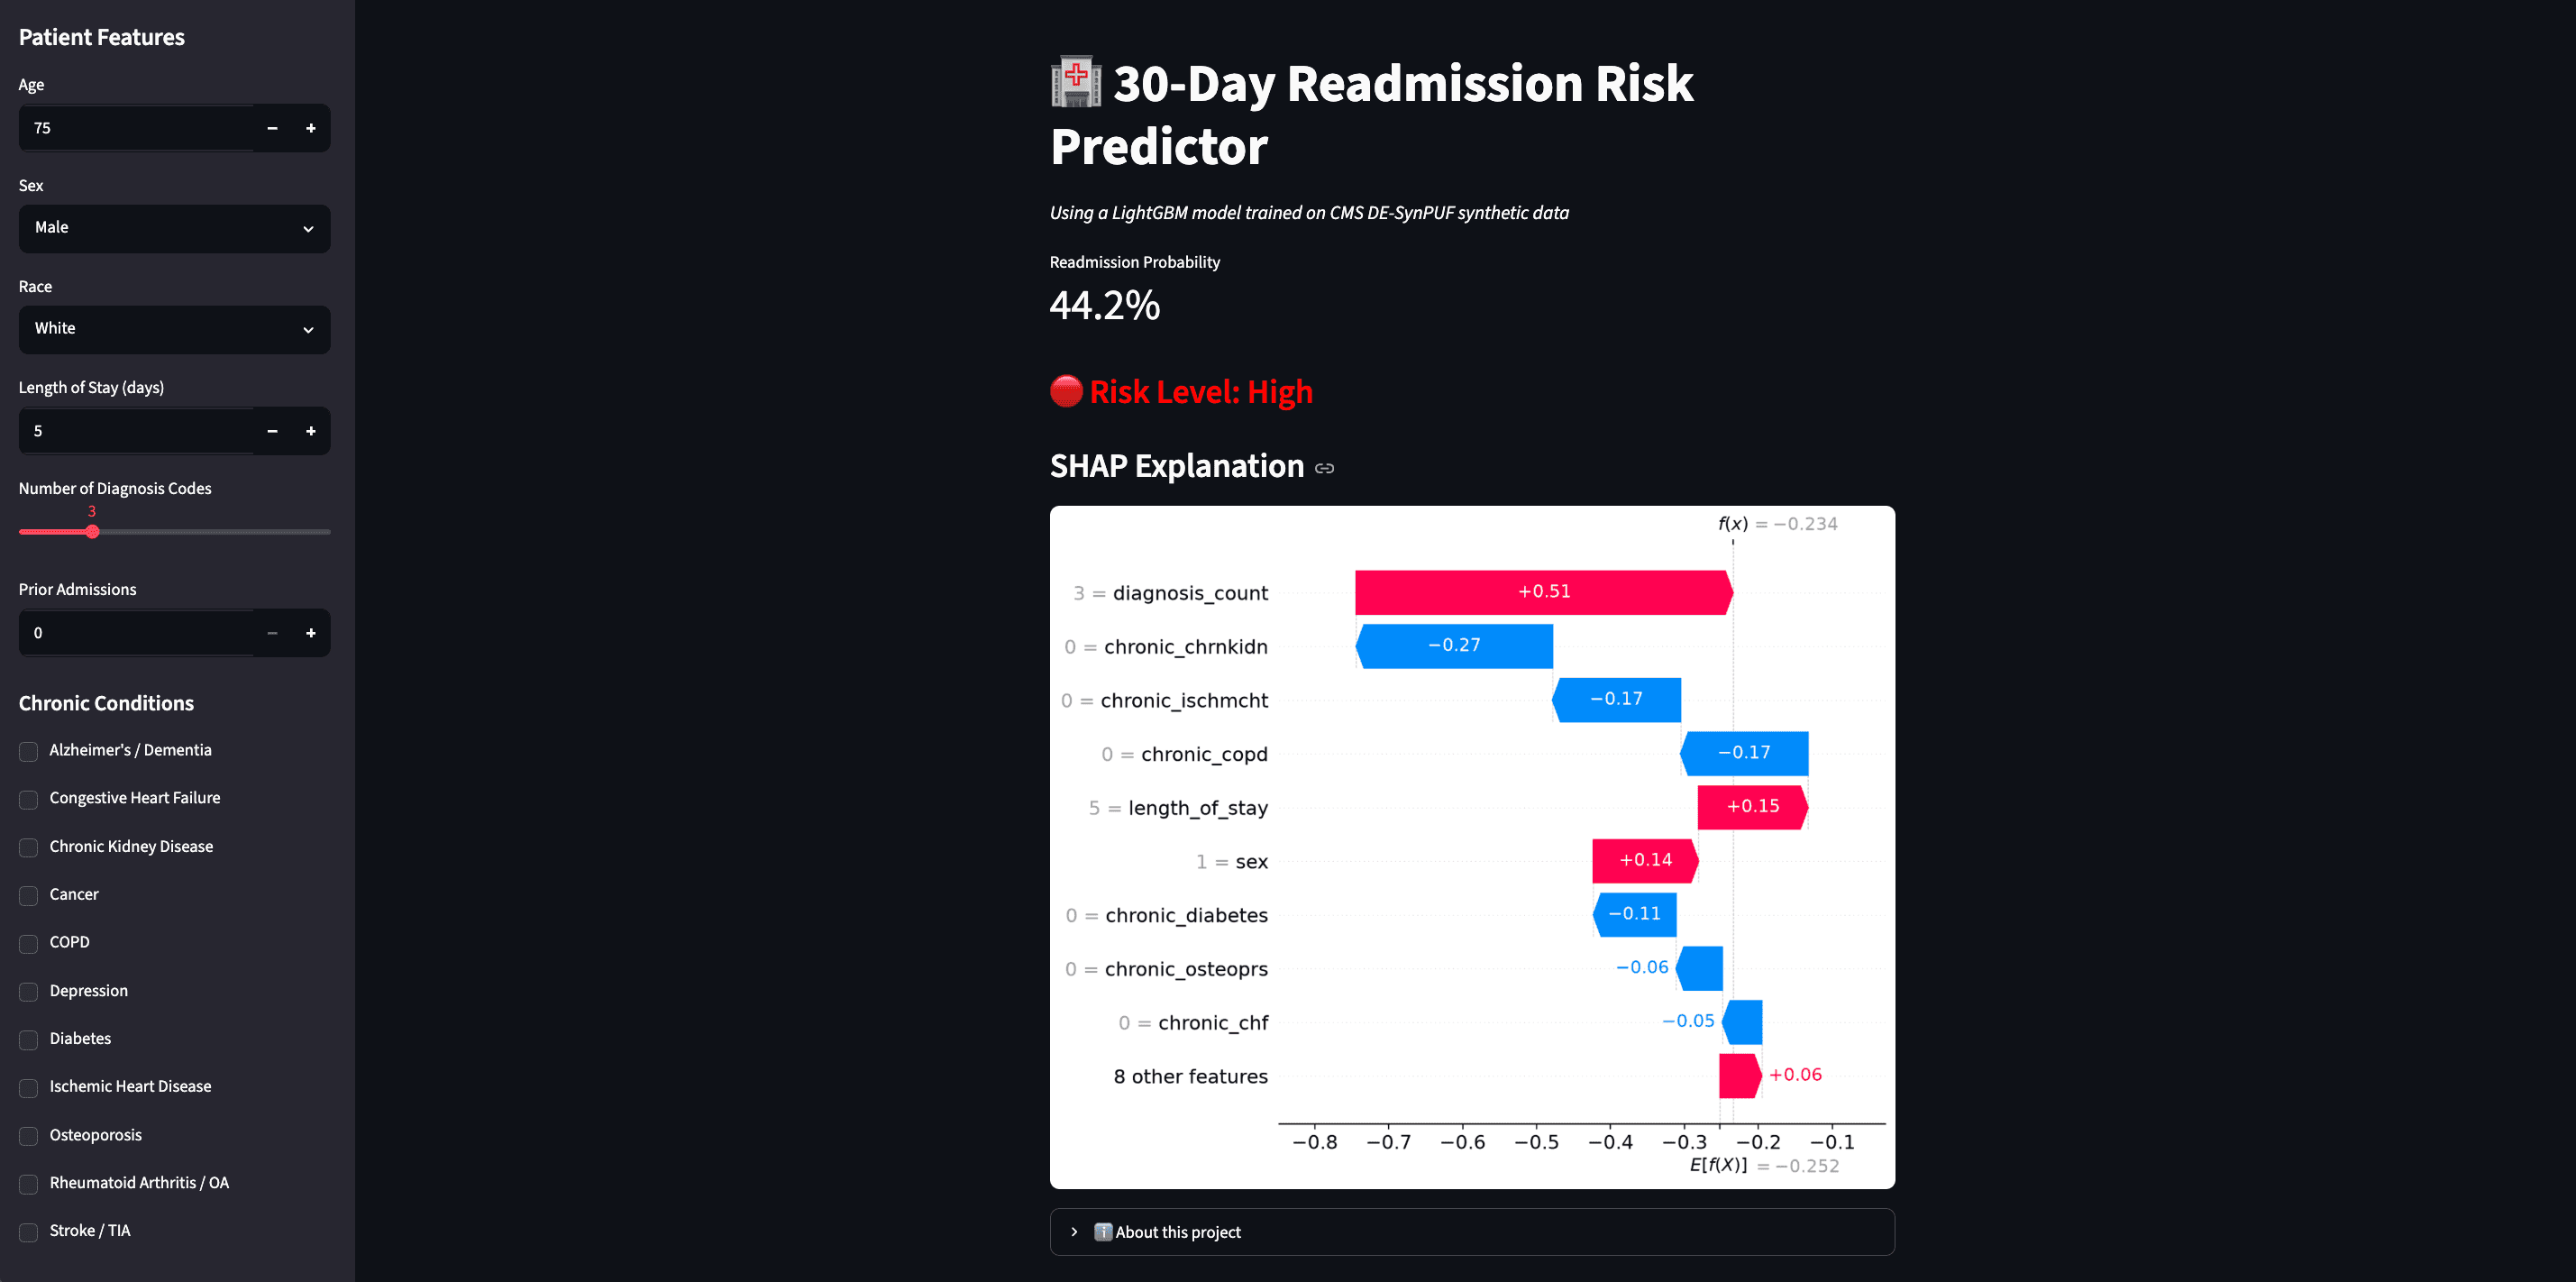
Predicts 30-day unplanned hospital readmissions using Medicare claims data. LightGBM classifier with monotonic constraints for clinical correctness, SHAP interpretability, and full experiment tracking via MLflow.
Kaggle: Biohub Cell Tracking
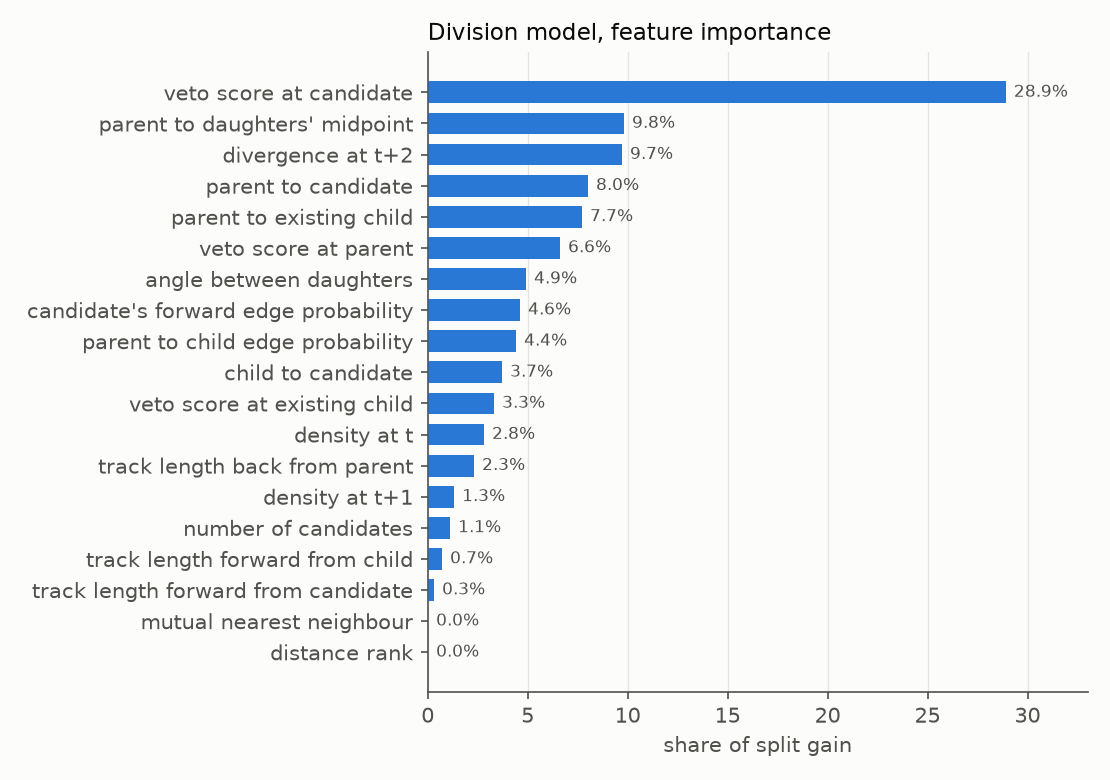
Silver medal, 98th of 4,017 teams. Tracking every cell through 3D light-sheet movies of a developing zebrafish embryo, with a LightGBM classifier that decides where cells divide.
Kaggle: Smartphone Addiction
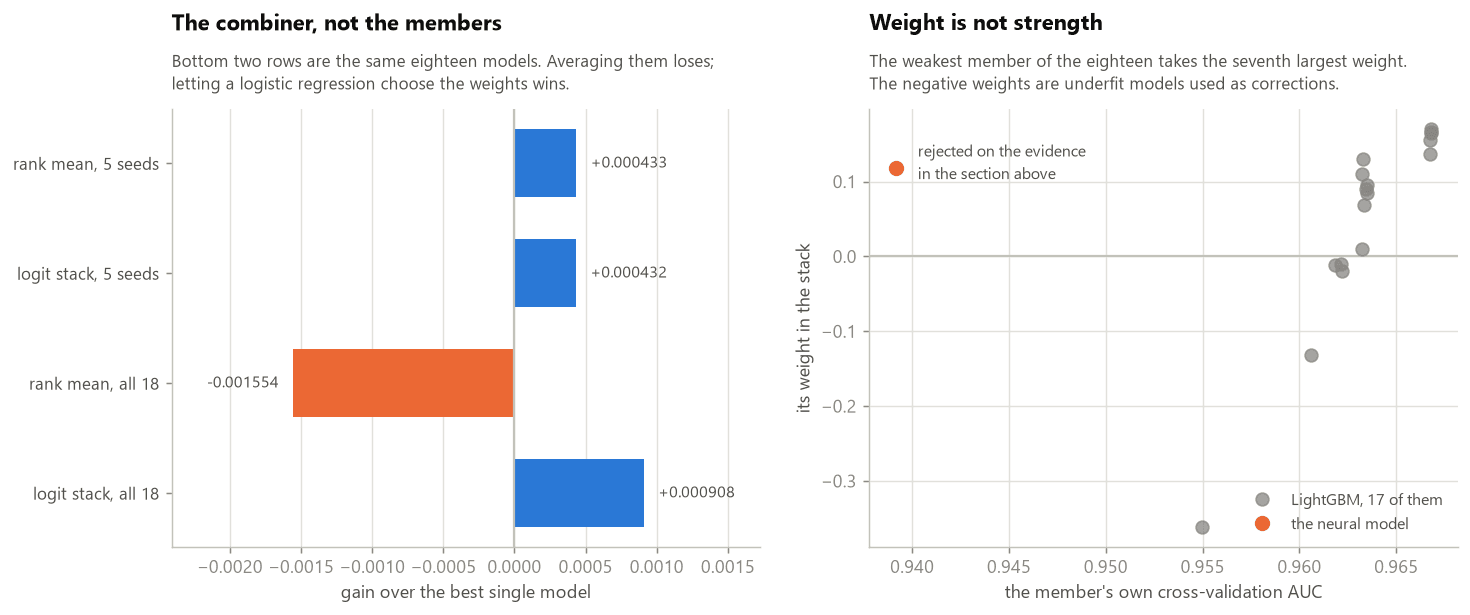
78th of 3,532 teams on Kaggle's Playground Series S6E8, predicting smartphone addiction from 691,369 synthetic rows with missing values in every column. Target encoding, a 65-member stacked ensemble, and a test for admitting public out-of-fold predictions.
Conversational Intelligence
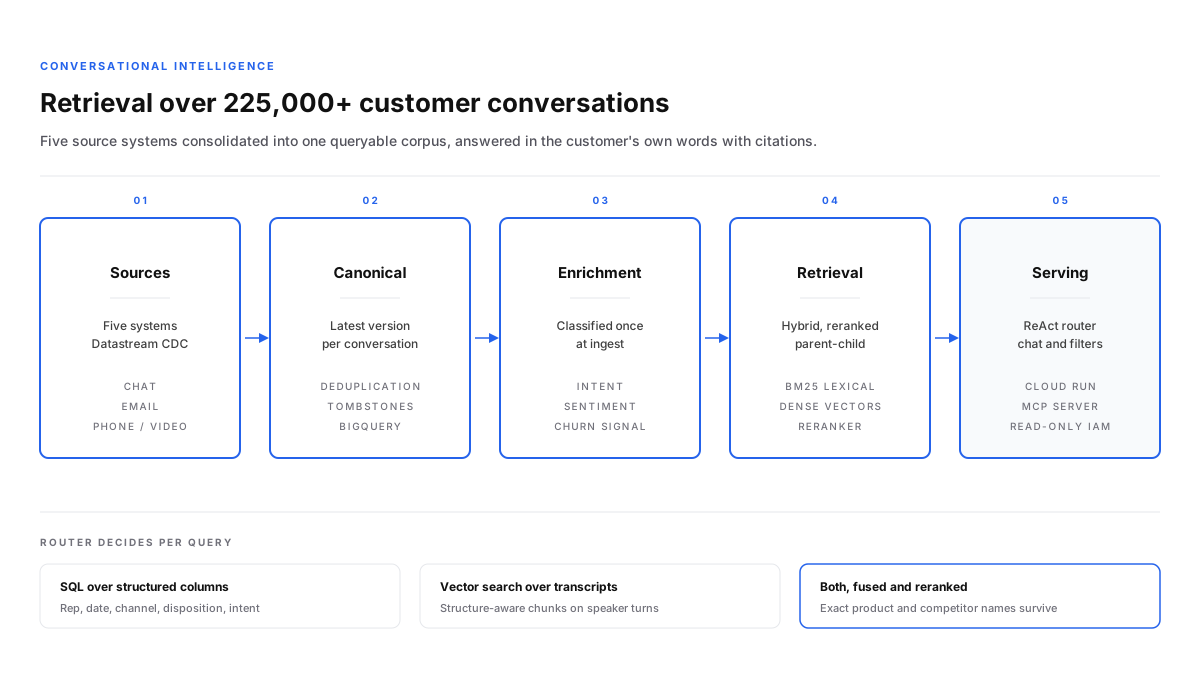
A retrieval system over 225,000+ customer conversations that answers questions in the words customers actually used, with citations back to the specific interaction.
REDX Email Operations
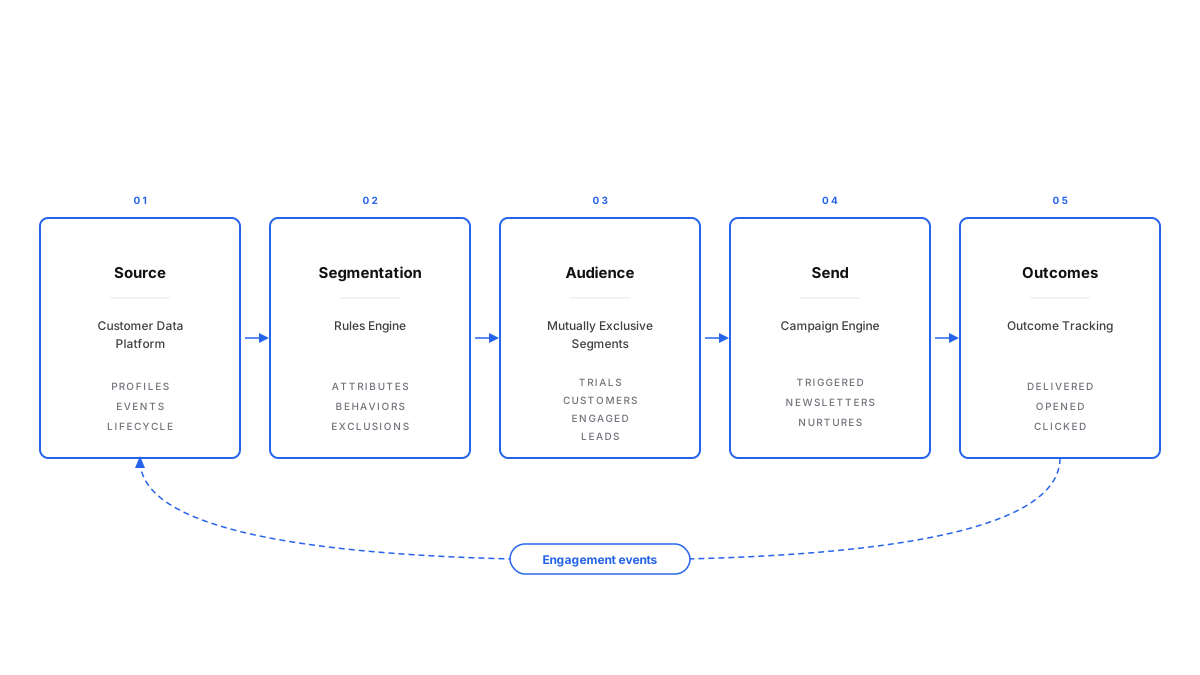
The email infrastructure at REDX: roughly 800K sends a month to 100K+ contacts, across a rules engine that produces mutually exclusive audience segments.
Executive Reporting Pipeline
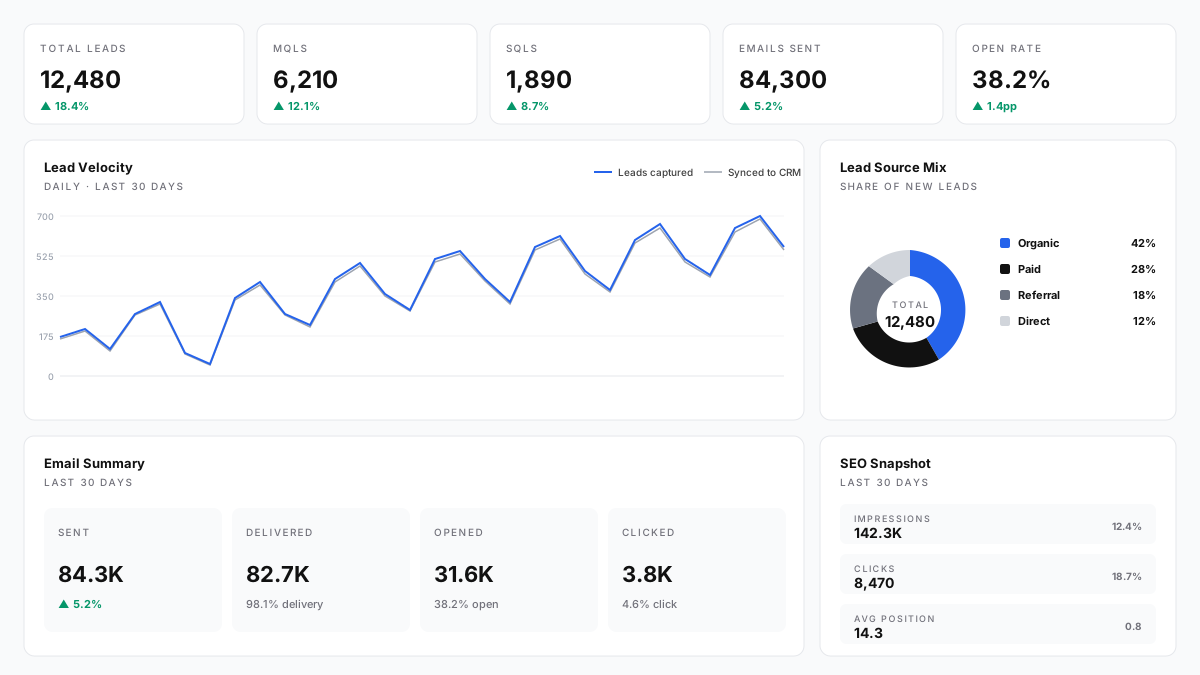
The GCP data platform behind marketing reporting: BigQuery warehouse, scheduled transformation jobs, a curated core table layer, and reverse ETL back into the operational tools.
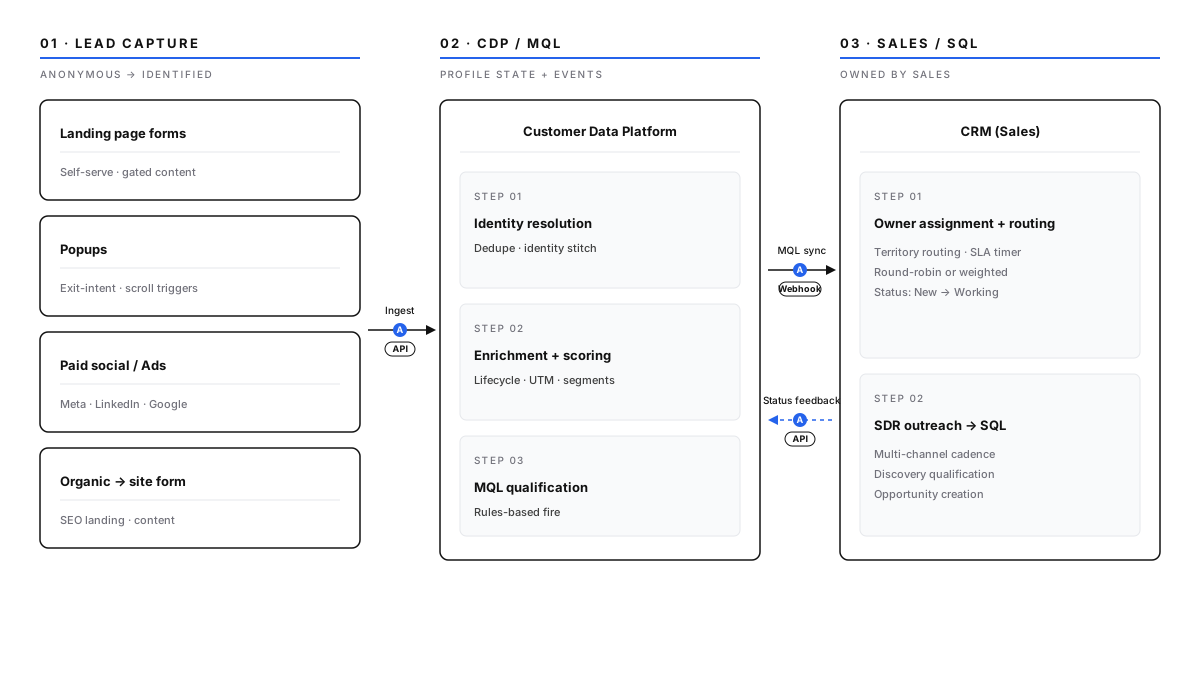
Lead Data Pipeline
Carries a lead from capture into the sales platform without anyone touching it: identity resolution, enrichment, and qualification, at a one-minute median.
Expense Snap
Android and iOS expense tracker that reads a receipt on the device and writes it to a Google Sheet you own. No server, no cloud OCR, and no third party ever sees the data.
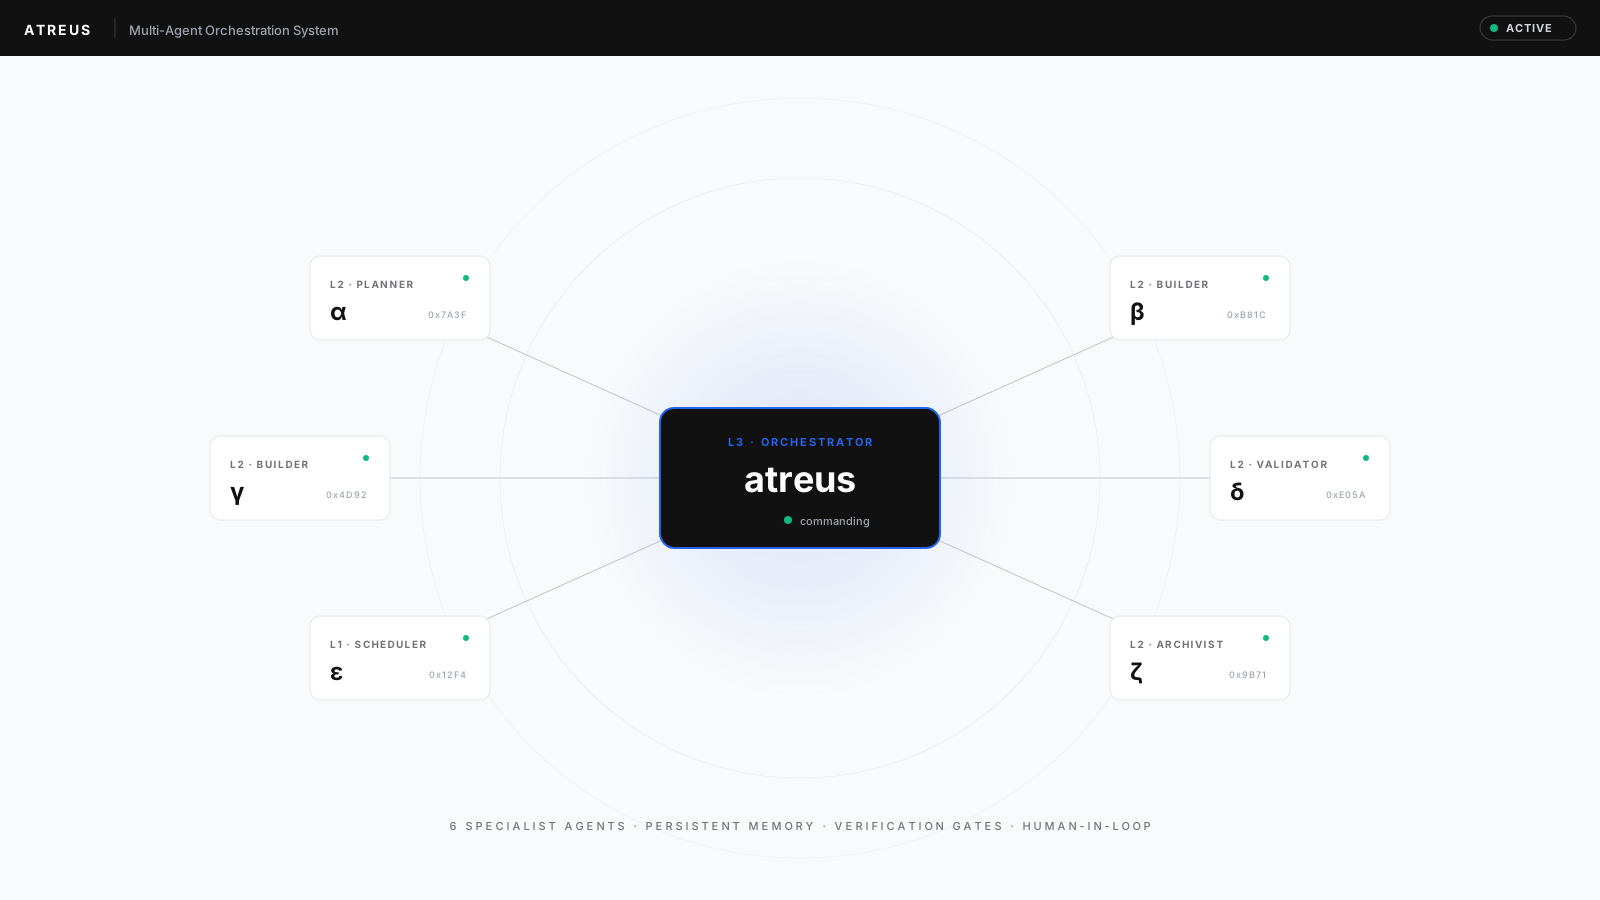
Atreus
A self-hosted agent system I describe work to in plain language: it branches, edits, builds, verifies the output against the real artifact, and reports back with a preview link.