Kaggle: Smartphone Addiction
78 of 3,532 · private LB 0.97103 · 170 logged experiments
The competition, and the finish
Playground Series S6E8 asked for the probability that a survey respondent is labelled addicted to their smartphone, scored on ROC AUC over 691,369 synthetic rows and twelve features, every one of them carrying between 4% and 20% missing values. I finished 78th of 3,532, private AUC 0.97103, inside the top 2.2 percent.
I ran it as an experiment ledger rather than a model hunt. Every run is a row recording the configuration, the cross-validation mean, the fold standard deviation, and the leaderboard score once it came back, including the runs that failed. There are 170 of them. A number only entered the ledger if it came from a clean top-to-bottom notebook execution, because hidden state is the one failure mode a notebook workflow cannot otherwise rule out.
The fold assignment was fixed and checksummed before any modelling began. That is about ten lines of code, and it is what makes everything below measurable: an out-of-fold prediction saved in week one can be combined with one from week four and trusted.
What moved the score, and what did not
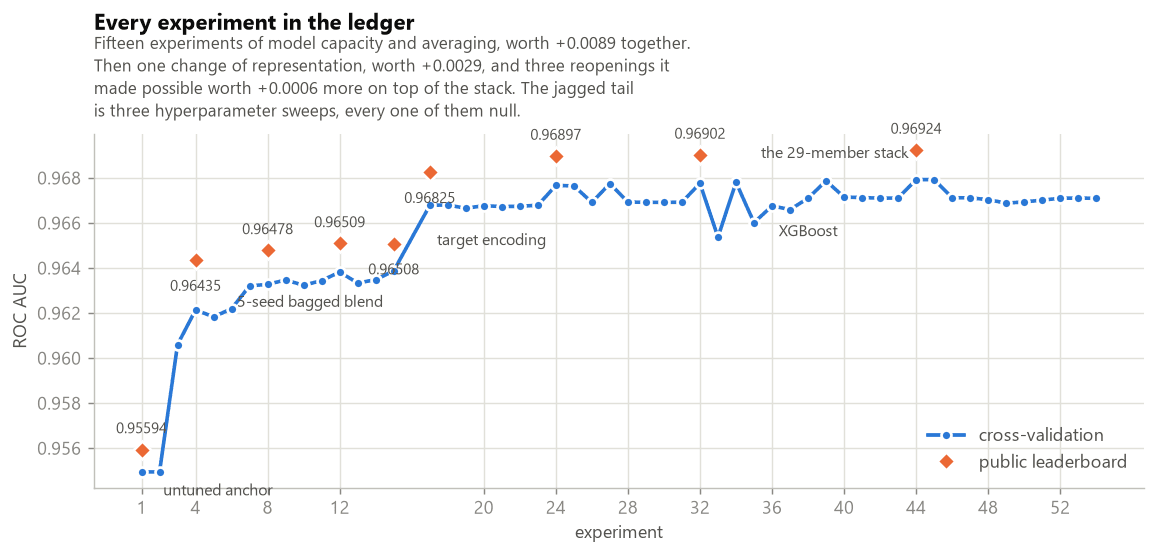
Two things worked. Target encoding all twelve columns was the largest single gain at +0.0033 AUC, fitted inside an inner split so that a row's encoded value never comes from a fit that saw its own label. A block of composition ratios, shares and rates stated between columns, was worth a further +0.0004 to +0.0009.
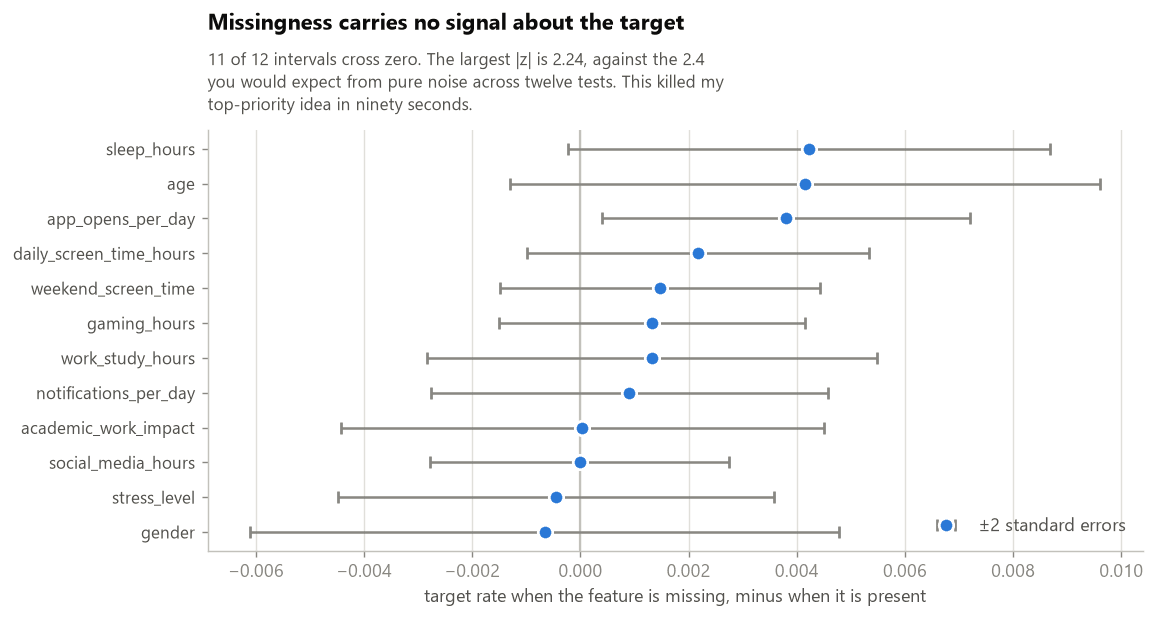
Everything else returned nothing measurable: missingness indicators, threshold rules, pairwise crossed encodings, quantile bins of derived ratios. Missingness was my highest-priority hypothesis and a ninety-second diagnostic killed it, since no feature shows a target-rate shift outside sampling error. Being wrong cheaply is what left time for the ideas that paid.
Correlation does not predict blend value
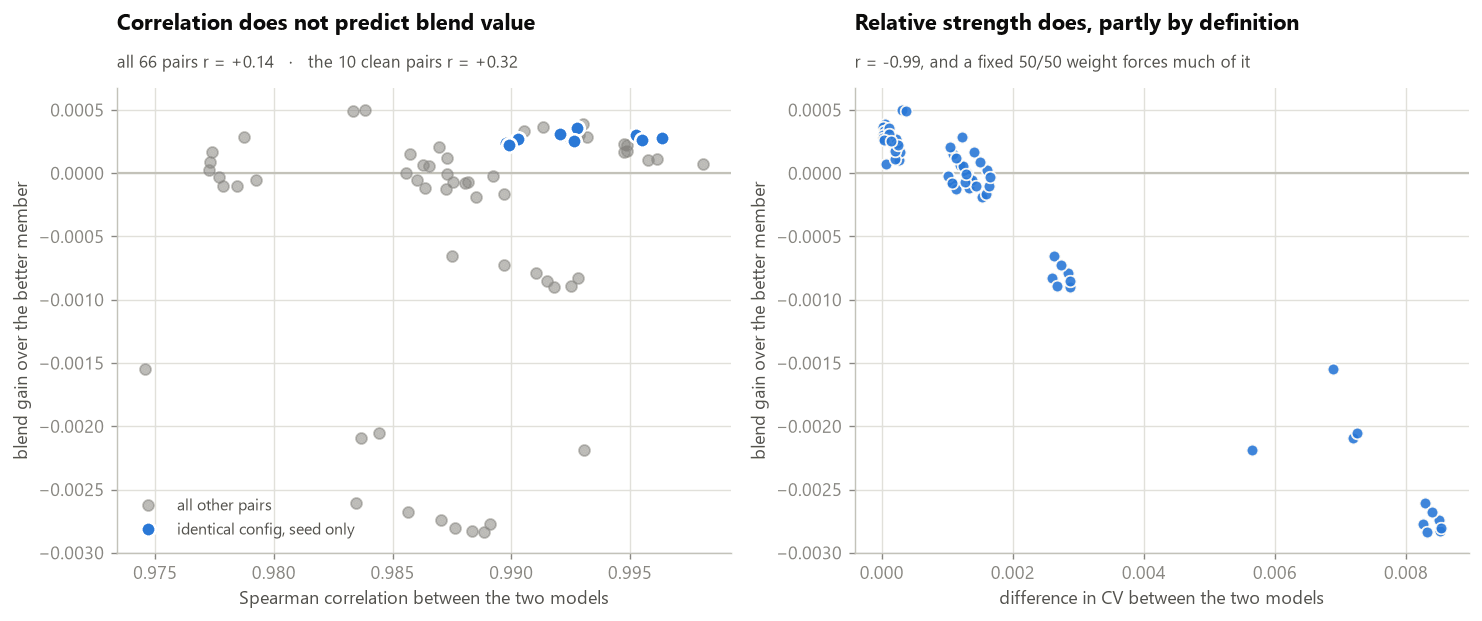
The standard advice is to blend models that are individually strong and mutually uncorrelated. Measured directly across all 66 pairs of models trained here, the relationship between rank correlation and whether averaging two of them helps came out at +0.14, which is close to none at all.
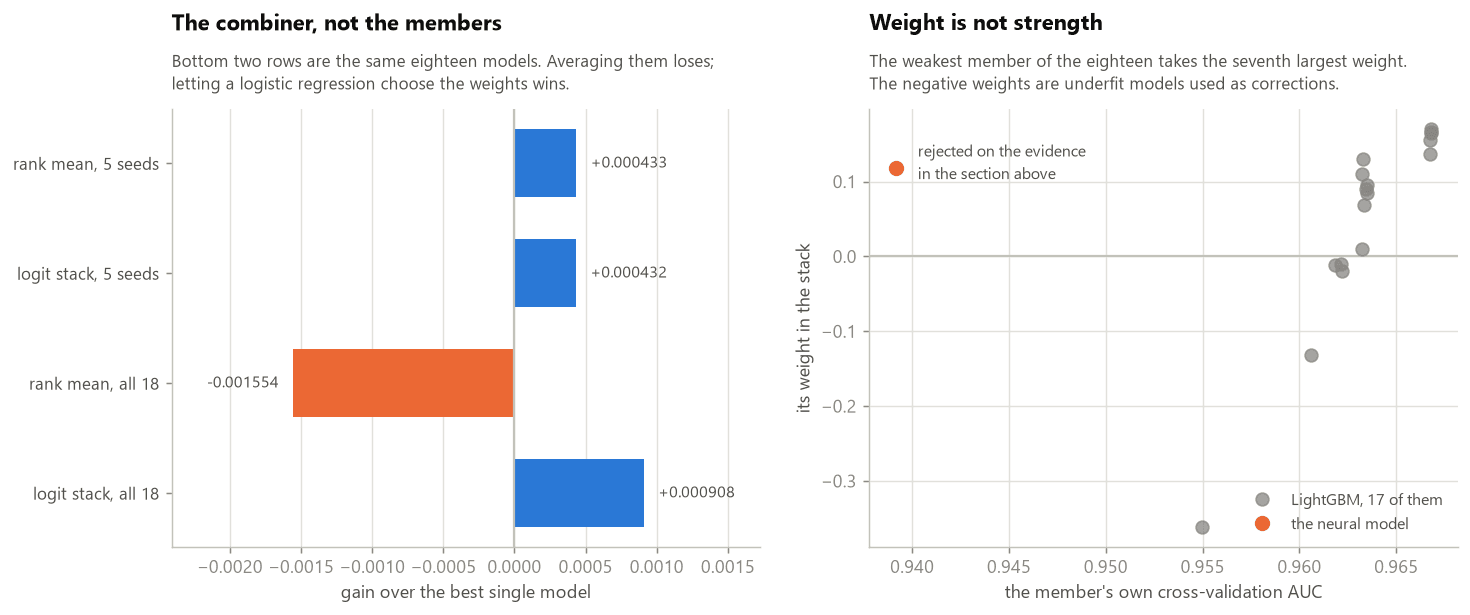
The finding has a boundary, and it is worth stating because I first stated it too broadly. Every test behind it combined models by averaging, and an equal-weight average cannot give a member a small weight or a negative one. Holding the same out-of-fold vectors fixed and changing only the combiner, the average lands 0.001554 below the best single model while a logistic regression lands 0.000908 above it. So correlation does not predict equal-weight blend value, and it says nothing at all about a fitted combiner. A diversity claim is a claim about a member set and a combiner together.
Verifying an outside model's fold split
Public out-of-fold libraries are permitted in this competition, and consuming one safely needs a test I could not find published anywhere.
A prediction vector built on a different fold partition is still out-of-fold for each row, so it scores normally and looks clean. The model behind its value on your training rows, however, trained on rows sitting inside your validation fold. Feed it to a combiner and your cross-validation score rises while the leaderboard stays where it was.
The test is to recompute per-fold AUC on that vector using your own fold assignment, and to admit it only if the numbers reproduce the author's own published per-fold scores in order. A fold AUC is a property of exactly which rows sit in the fold, so agreement is proof and disagreement is proof of the opposite. Ten candidates passed and two were rejected, including the highest scoring one I examined: it read 0.96810 on my folds where its author had published 0.96593, and a vector that scores higher on your folds than on its own is a mixture rather than a held-out prediction.
This is the part worth handing to someone else. It is a reusable gate, and anyone building on predictions they did not generate needs one.
When the instrument is too coarse to read
Four submissions carrying four different cross-validation scores returned the identical public leaderboard number. That is the resolution of the instrument rather than a coincidence: the public split's standard error is near 0.0006, wider than every gain after the fourth experiment, while more than a hundred teams sat within three ten-thousandths of each other.
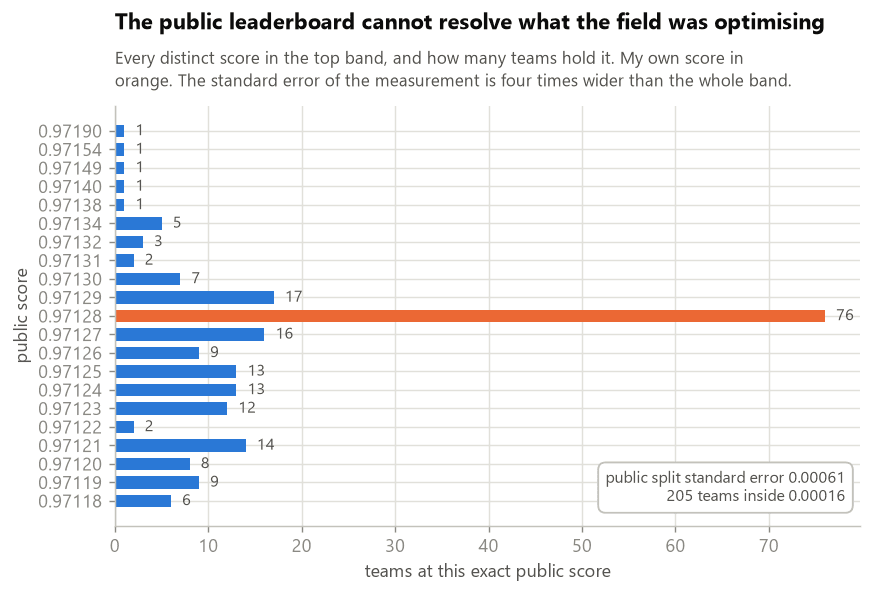
The practical consequence is to weight cross-validation over the public leaderboard when choosing a final submission, and to know which of your own measurements the instrument can actually separate. My own stack reached 0.970127 out of fold: gradient-boosted trees, two tabular neural networks, and verified public libraries, pruned to 65 members and combined by a logistic regression fitted inside the same fold split as the members it weighs.
Key results
- Final placement: 78 of 3,532 teams (top 2.2%)
- Private LB: 0.97103
- Best CV: 0.970127 (65-member logistic stack, verified folds)
- 170 logged experiments, failures included
- 12 public out-of-fold sources screened, 2 rejected on fold protocol
Stack