Kaggle: Biohub Cell Tracking
98 of 4,017 · silver medal · private LB 0.928
Overview
Biohub's cell tracking competition asked for every cell in 3D light-sheet movies of a developing zebrafish embryo: its centre in each frame, its link to itself in the next frame, and the moments it divides into two. The score measures how closely the predicted frame-to-frame links overlap the annotated ones, reduced when a prediction has more cells than the organisers estimate, plus a tenth of the same overlap measured on divisions alone. Only some cells in each movie are annotated, so every score is measured on a sparse sample.
I finished 98th of 4,017 teams, a silver medal. The pipeline is a temporal 3D U-Net detector, a transformer edge scorer and an ILP linker, with two additions on top: a small network that moves each detected centre by up to 2 µm, and a LightGBM model that decides cell divisions from 19 geometric and network features. The division model replaced a rule-based step and was the largest single gain on the private leaderboard, from 0.921 to 0.929.
Pipeline
Detection runs a temporal 3D U-Net on volumes downsampled 4x in y and x, fuses two seeds, and extracts peaks by local maximum. A transformer scores candidate links between consecutive frames from U-Net features at both ends, run forward and backward in time and fused. An integer linear program picks links from the scored candidates, followed by gap closing, a motion relink and a gap filler that recovers weak detections between broken tracks. A refinement head then shifts each detection, and a LightGBM classifier adds divisions.
The detector, edge scorer and linker are the public stack from the competition's Code tab, with its settings unchanged. The refinement head and the division classifier are mine.
Validation
The public detector weights were trained on 180 of the 199 training videos, so the remaining 19 are the only local videos that behave like the hidden test set. The network that vetoes divisions was trained on every video from one of the two embryos, so for anything involving divisions only the other embryo's videos are out of sample. Both of my components were fitted on training videos and scored on those 19.
Single-setting changes to the base stack did not transfer from local scores to the leaderboard. Lowering the division veto threshold from 0.20 to 0.10 read +0.0033 locally and lost 0.002 on the leaderboard, and opening two division gates read +0.0041 and also lost 0.002. Settings on the base stack were left as published.
Coordinate refinement
Detections are local maxima on a grid with 1.625 µm spacing in every axis, so each centre carries up to about 0.8 µm of quantisation error per axis before any model error. The refinement head reads the U-Net decoder features at the detection and its six face neighbours, 224 values, and predicts a 3D shift through a two-layer network whose output is bounded to 2 µm. Its training targets come from running the pipeline on training videos, matching detections to annotated cells within 4 µm, and regressing the offset: 32,740 pairs from 59 videos.
The training pairs carry an embryo-level bias. In one embryo the annotated centre sits 0.97 µm higher in z than the detection on average, and every one of its 14 held-out videos falls between 0.68 and 1.35 µm. In the other the offset is 0.10 µm. A head fitted on 19 videos, most of them from the first embryo, picked up that offset and made every video from the second embryo worse. Training on 59 videos with more of the second embryo among them fixed it: on the held-out 19 the head moved centres 24 percent closer to the annotation, and every video improved.
The final shift is the average of this head and a second head of the same architecture. On its own the second head scored 0.953 public and 0.917 private, mine 0.950 and 0.919, and the 50/50 average 0.956 and 0.921.
Division classifier
A division in the submission is a parent node with two outgoing edges. The base stack added divisions with a cascade of fixed checks: two distance gates, a mutual-nearest-neighbour test, a divergence test, a veto score from a second U-Net and a symmetry test. On the held-out videos it found 2 of 19 annotated divisions. I replaced the cascade with a classifier.
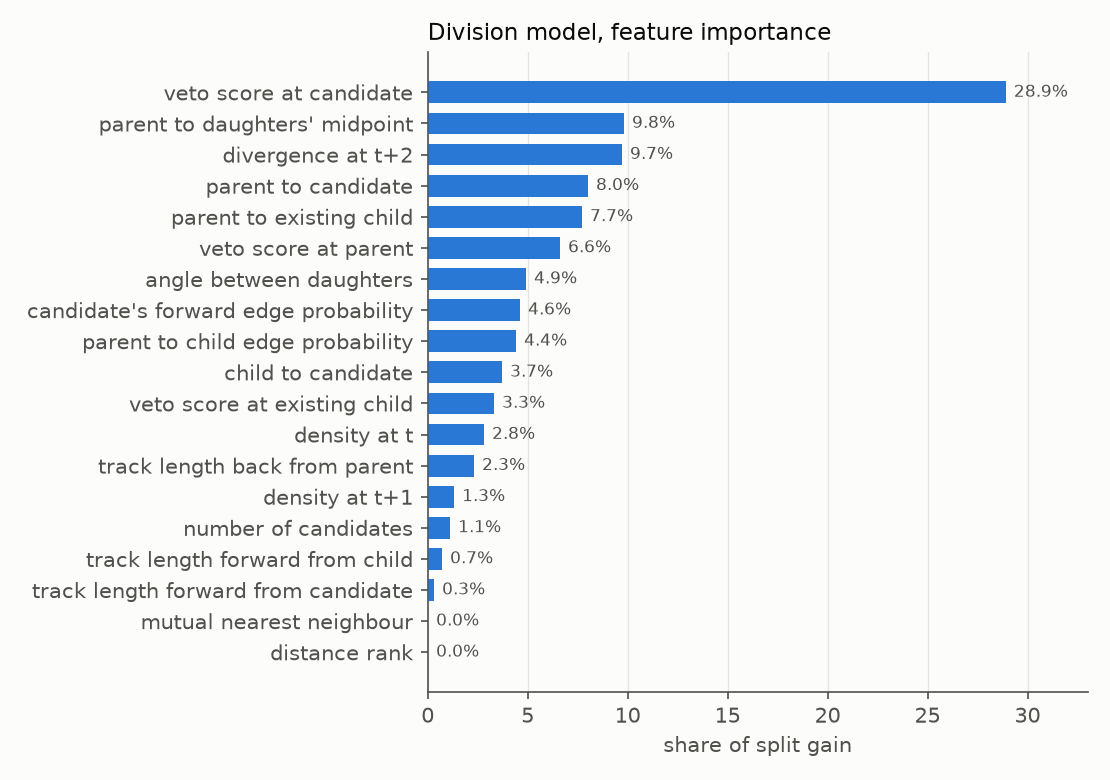
For every track node with exactly one successor, every unlinked detection in the next frame within 14 µm of the parent and 20 µm of the existing child is a candidate daughter. That gate is looser than the cascade's, so the classifier also sees the candidates the cascade rejected. Each candidate carries 19 features: distances between parent, child, candidate and the daughters' midpoint, how much further apart the daughters' successors are two frames on, the veto network's score at the candidate, the child and the parent, edge probabilities, the angle between the daughter directions, track lengths, and local density.
A candidate is positive when the parent matches an annotated division and both daughters match its two annotated children. Only candidates whose parent matches an annotated cell with an annotated successor are kept, since those are the only ones the metric scores. Across 119 training videos the pipeline logged 356,717 candidates, 8,083 of them scoreable, with 47 positives. LightGBM was trained on the 100 videos the detector had seen and evaluated on the 19 it had not. At inference candidates are accepted greedily from the highest score down, each parent and each daughter at most once, until the score falls below a threshold of 0.01.
On the held-out videos the model ranked candidates with an AUC of 0.991 and an average precision of 0.315, against a positive rate of 0.006, and raised the division Jaccard from 0.071 to 0.167. The veto network's score at the candidate carries the most gain, followed by the division geometry. The mutual-nearest-neighbour test, a hard gate in the cascade, carries none.
Threshold
False divisions are expensive. Each one adds a link the metric counts as a false positive when it touches an annotated cell, on top of a false positive in the division term. Retraining on 176 videos with 56 positives raised held-out average precision from 0.315 to 0.640, yet it scored lower on the private leaderboard: 0.928 against 0.929 at threshold 0.01, and 0.926 against 0.928 at 0.02.
Results
The base stack with the second coordinate head scored 0.953 public and 0.917 private. Averaging in my coordinate head raised that to 0.956 and 0.921, and the division classifier at threshold 0.01 to 0.957 and 0.929.
What did not work
Single-setting changes to the base stack, among them division veto thresholds of 0.10 and 0.25 and two wider division gates, scored 0.945 to 0.953 public and never improved on the unchanged stack. Scaling the coordinate shift to 0.5x scored 0.945, while 0.75x and 1.25x matched 1.0x. A blend weight of 0.35 between the two heads scored 0.952 and 0.65 matched 0.5. A five-seed ensemble of my head trained on 159 videos scored 0.954 against 0.956 for the single head, and a lower division threshold of 0.005 scored 0.947 against 0.957.
Choosing heads by distance to the annotation on the held-out videos ranked them in the opposite order to the leaderboard.
Key results
- Final placement: 98 of 4,017 teams, silver medal (top 2.5%)
- Private LB: 0.928 final, 0.929 best submission
- Division classifier: held-out AUC 0.991, private score +0.008
- Coordinate head: centres 24% closer to the annotation on held-out videos
Stack