CMS Readmission Predictor
AUC 0.6648 · 67K admissions · SHAP interpretability
Built a 30-day hospital readmission prediction pipeline on CMS DE-SynPUF synthetic Medicare claims data (Sample 1, approximately 67,000 admissions). The ETL layer uses DuckDB for out-of-core SQL joins across beneficiary summary and inpatient claims files, deriving the readmission label by windowing each discharge against subsequent admissions within 30 days.
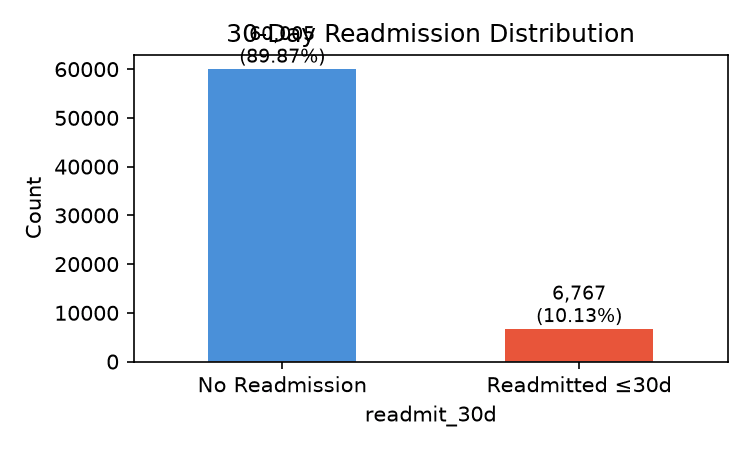
The model is a LightGBM classifier with balanced class weights to handle the 10% positive rate. Monotonic constraints enforce clinical directional correctness on prior admissions, age, and length of stay, preventing the model from learning spurious inverse relationships in the synthetic data. MLflow tracks all experiments with logged hyperparameters, metrics, and serialized model artifacts.
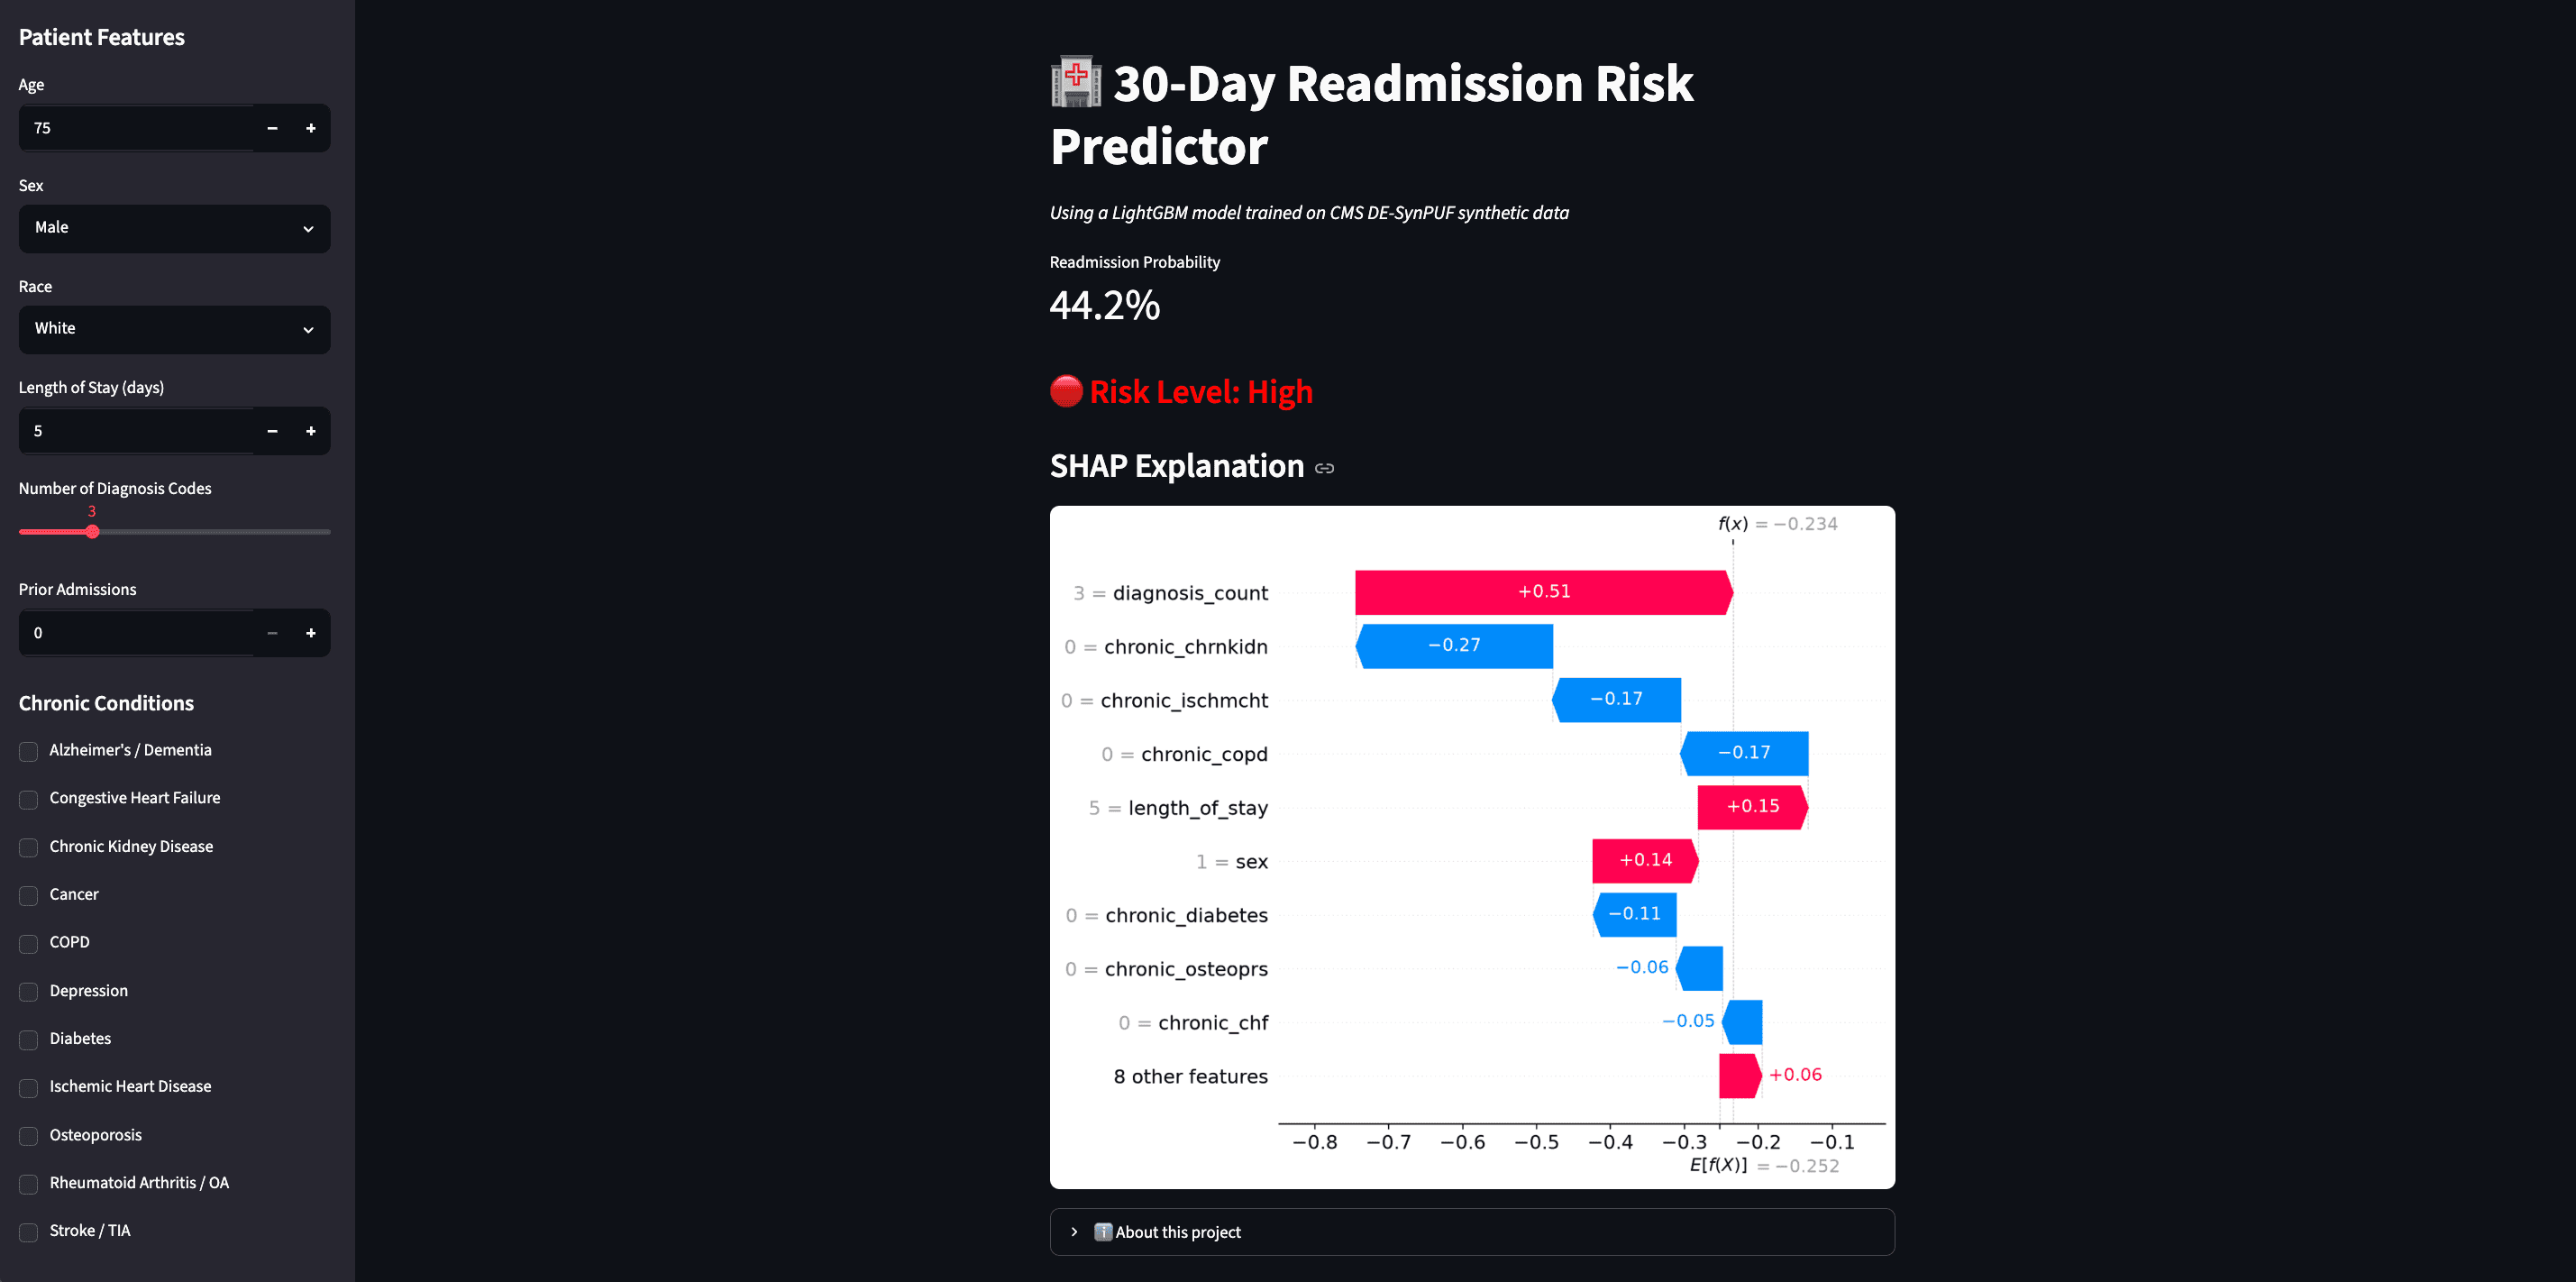
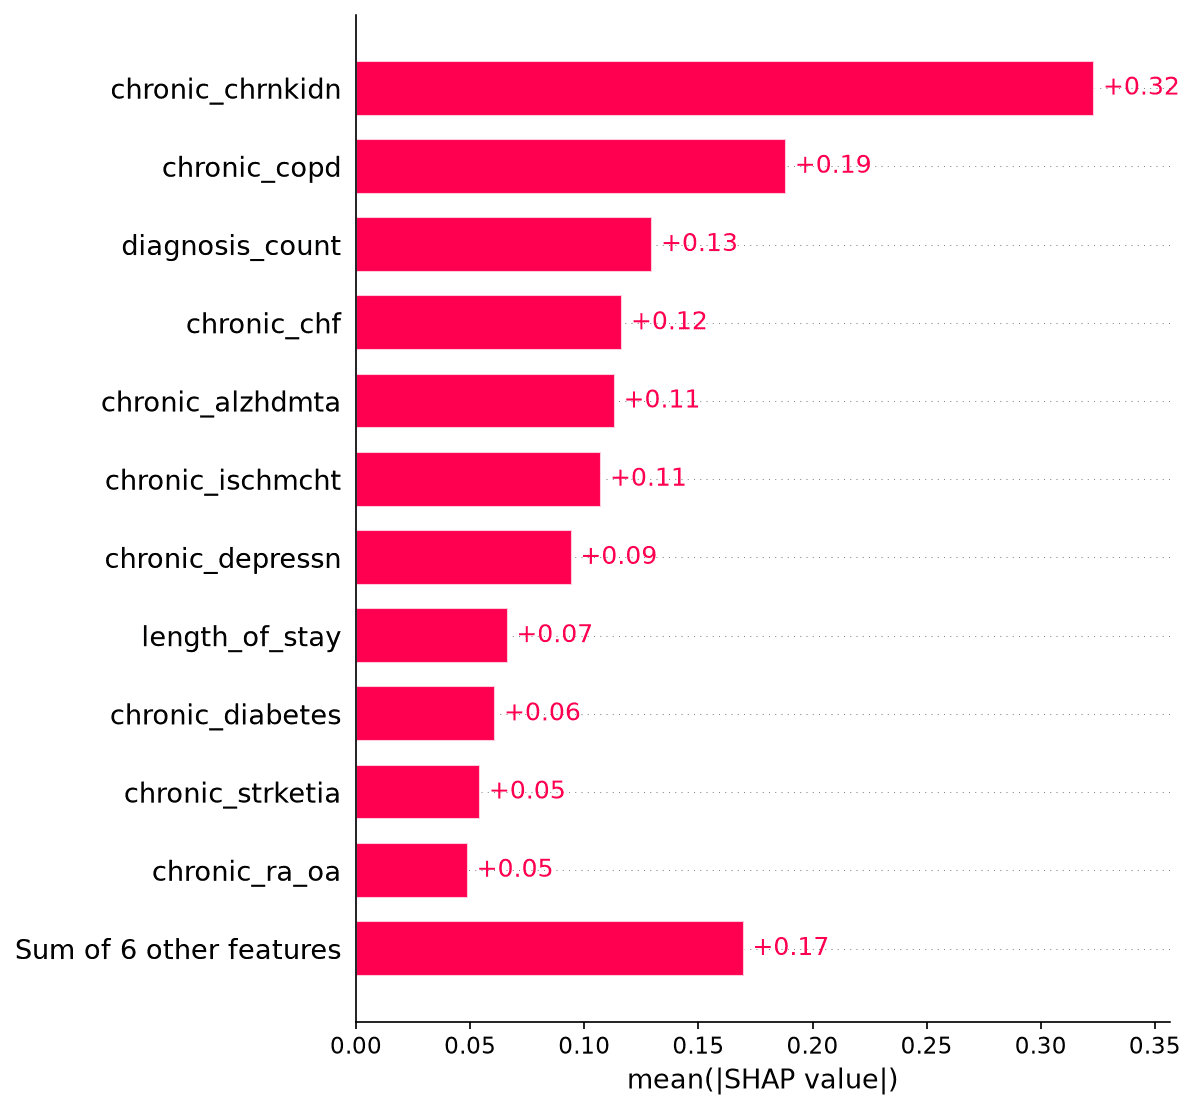
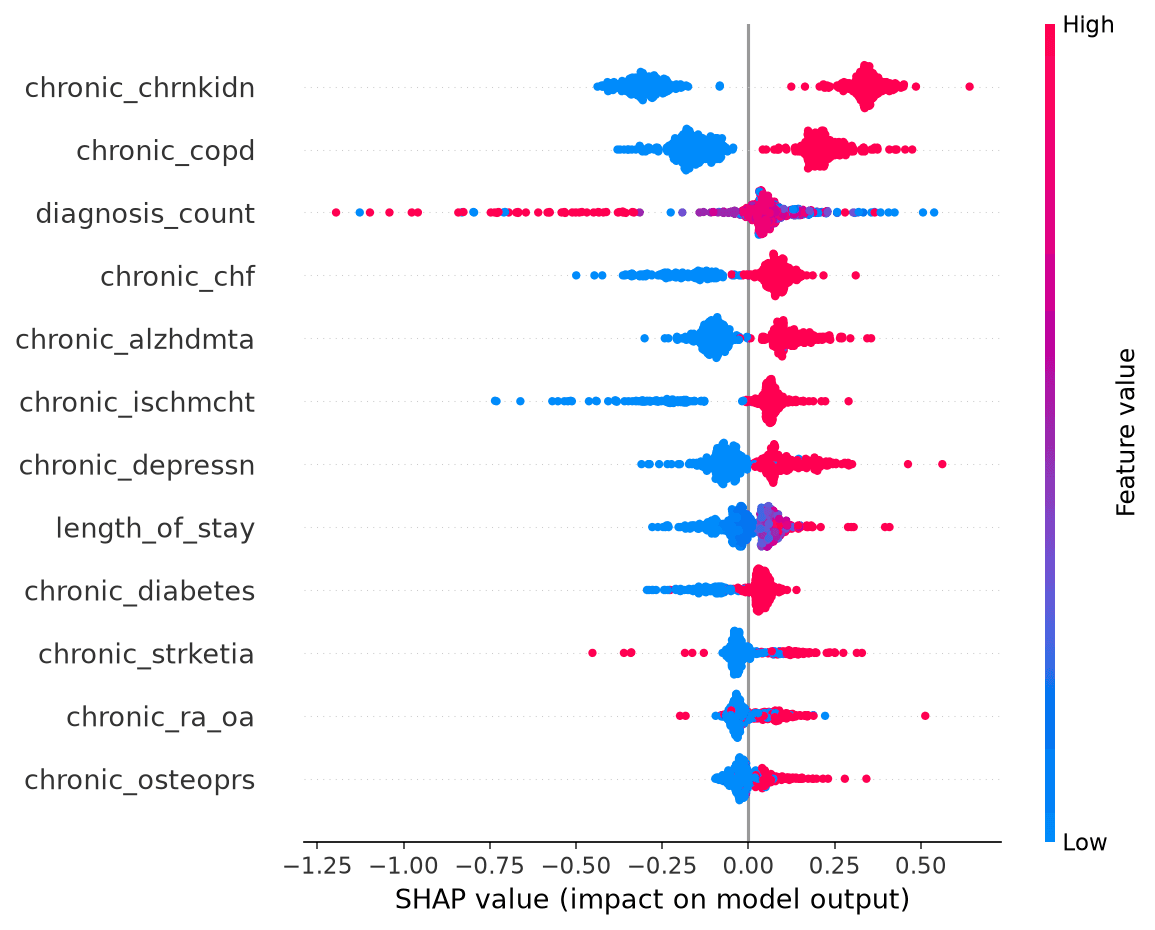
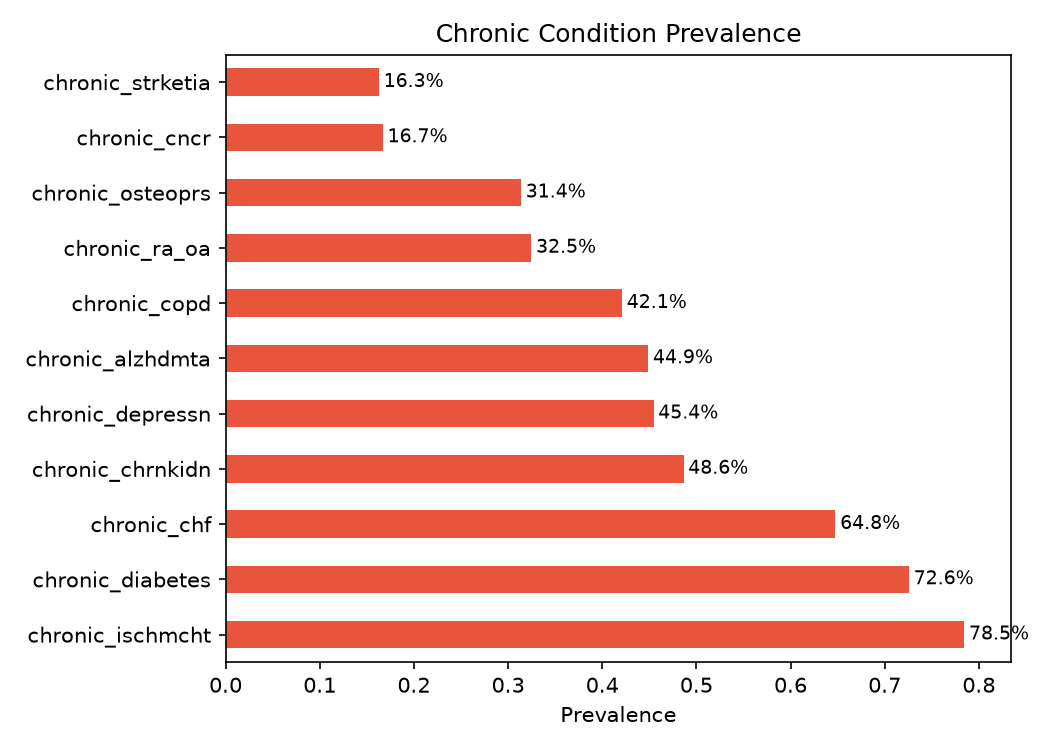
Interpretability is built on SHAP TreeExplainer. The top predictive features are chronic kidney disease, COPD, and congestive heart failure, aligning with CMS Hospital Readmissions Reduction Program target conditions. An interactive Streamlit demo lets users input patient features and see both the predicted readmission probability and a per-patient SHAP waterfall explanation of the driving risk factors.
Final model AUC-ROC: 0.6648 on a held-out stratified test set, which is realistic for a claims-only feature set on synthetic data without lab values, clinical notes, or social determinants of health.
Analysis
Key results
- AUC-ROC: 0.6648 on stratified held-out test set
- 67K admissions processed via DuckDB out-of-core ETL
- 17 features with 3 monotonic constraints enforcing clinical priors
- Full per-patient SHAP interpretability
Stack