Executive Reporting Pipeline
BigQuery warehouse · reverse ETL · zero manual pulls
What sits under the dashboard
The executive dashboard is the visible end of this, but the substance underneath it is a data platform on GCP. Campaign and lead data lands in BigQuery through Customer.io's native sync, which I configured; everything downstream of that landing is mine -- Cloud Storage buckets, the Cloud Functions including the one that serves the dashboard front end, the scheduling and orchestration, and the table and schema design.
Curated tables and reverse ETL
The dashboards read from a curated intermediate table layer rather than querying raw data directly, so the reporting surface stays stable when an upstream shape changes. Reverse ETL pushes warehouse data back out into the operational tools, which closes the loop: the warehouse is not just somewhere data goes to be looked at.
Self-service is what removed the manual pulls
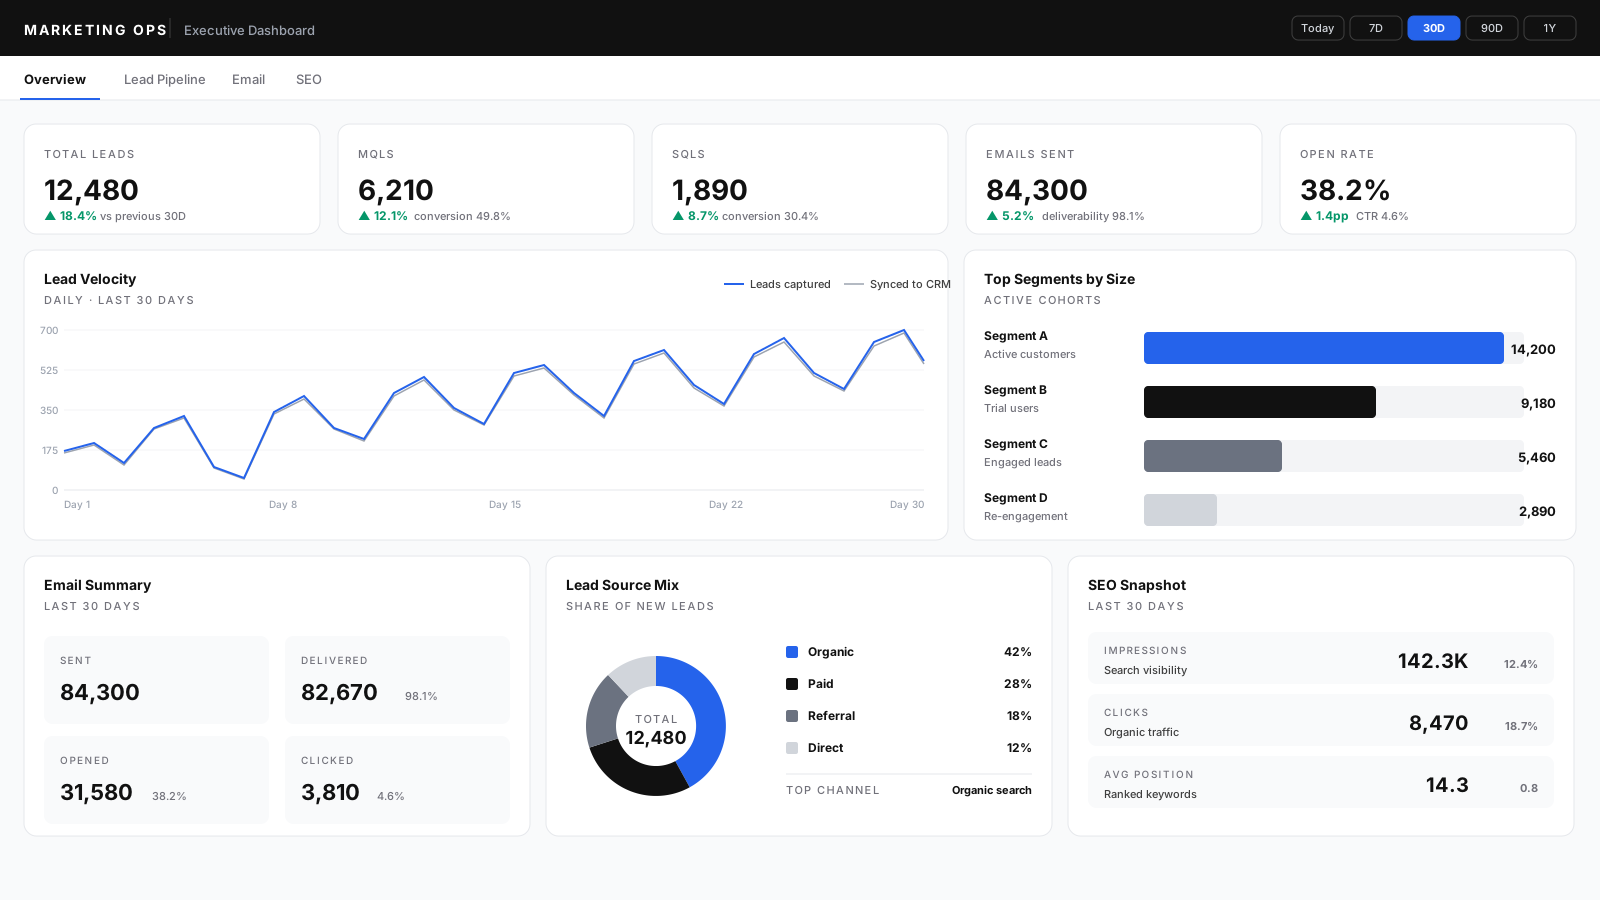
It covers lead totals, MQL and SQL counts, lead velocity, source mix, email engagement and an SEO snapshot, with eight built-in time ranges plus custom. That self-service range is the part that actually eliminated the manual pulls -- executives, the marketing manager and the marketing team answer their own questions instead of queuing a request.
Key results
- Eliminated all manual data pulls
- 8 built-in time ranges plus custom
- Consumed by C-suite and the marketing team
Stack